Research Article | | Peer-Reviewed

Trait Correlations and Path Analysis for Kernel Yield Improvement in Groundnut (Arachis hypogaea L.) Genotypes

Received: 16 November 2024     Accepted: 5 December 2024     Published: 27 December 2024
Views:       Downloads:
Abstract

Groundnut (Arachis hypogaea L.), or peanut, is a self-pollinating legume valued for its oil-rich kernels and nitrogen-fixing roots. Given the limited availability of enriched germplasm in Ethiopia, indirect selection through association studies is pivotal for identifying traits linked to high kernel yield. This study evaluated fifteen groundnut genotypes using a Randomized Complete Block Design with three replications to analyze correlations and path coefficients for yield improvement. Significant differences among genotypes were observed for key traits, including days to flowering and maturity, number of mature pods per plant, 100-kernel weight, and kernel yield, indicating the presence of variability among the genotypes in terms of these traits. Correlation analysis revealed a significant negative phenotypic correlation between kernel yield and days to maturity, but positive correlations with number of mature pods per plant and number of kernels per pod. The result revealed that late maturing genotypes produce high number of pods in turn exhibit higher kernel yield than early maturing ones. Genotypic correlations reinforced these findings, highlighting number of mature pods per plant as a critical determinant of yield. Path coefficient analysis indicated that the number of mature pods per plant had the highest direct positive effect on kernel yield, suggesting that enhancing this trait could significantly boost productivity. These results underscore the importance of selecting for high number of mature pods per plant in groundnut breeding programs to enhance kernel yield.

Published in Advances in Bioscience and Bioengineering (Volume 12, Issue 4)
DOI 10.11648/j.abb.20241204.14
Page(s) 98-104
Creative Commons

This is an Open Access article, distributed under the terms of the Creative Commons Attribution 4.0 International License (http://creativecommons.org/licenses/by/4.0/), which permits unrestricted use, distribution and reproduction in any medium or format, provided the original work is properly cited.

Copyright

Copyright © The Author(s), 2024. Published by Science Publishing Group

Keywords

Genotypic Correlation, Kernel Yield, Phenotypic Correlation, Pod Per Plant, Shelling Percentage

1. Introduction
The groundnut (Arachis hypogaea L.), also known as the peanut, is a self-pollinating legume crop. Groundnut kernels are consumed in various ways by humans, while its branches and leaves are used as animal feed. Agronomically, groundnut roots contribute to soil fertility by fixing nitrogen. Nutritionally, groundnuts are rich in oil, containing 31.7-57% oil , and protein, with a content of 22.78-25.69% . This crop is cultivated in over 100 countries for its value as food, oil, and feed . According to the Food and Agriculture Organization of the United Nations (FAO) , the top five groundnut-producing countries are China (18,357,437 tons), India (10,244,000 tons), Nigeria (4,607,669 tons), the United States (2,898,140 tons), and Sudan (2,355,000 tons). In 2021, Ethiopia produced 207,759 tons of groundnuts on 110,000 hectares, with an average productivity of 1.88 tons per hectare. In the Benishangul Gumuz region, 84,372 private peasant households produced 55,405.50 tons on 28,898.73 hectares, yielding an average of 1. 9 tons per hectare . Notably, groundnut productivity can reach up to 5. 50 tons per hectare in Israel .
To boost groundnut productivity in Ethiopia, the primary focus of groundnut breeding is on developing varieties with high kernel yield and disease resistance. Since groundnut is not native to Ethiopia and was introduced in 1920, its improvement relies heavily on genetic resources obtained from germplasm donor institutes, such as the International Crops Research Institute for the Semi-Arid Tropics (ICRISAT). The lack of enriched germplasm makes it challenging to obtain elite groundnut genotypes with desirable traits such as high kernel yield through direct selection. Consequently, improving groundnut kernel yield might be more effectively achieved through indirect selection and combining traits associated with kernel yield.
Association studies are particularly valuable in crop improvement, especially when germplasm availability is limited. These studies enable breeders to identify traits linked to the desired yield traits and use this information to combine multiple favorable alleles into a single genotype, by which the performance of the crop is enhanced, even with limited germplasm resources. Correlation analysis plays a crucial role in crop improvement by helping plant breeders identify relationships between different traits, such as crop yield and its related traits. Any cop improvement effort in increasing yield should consider yield related components which have direct and indirect share towards the yield . On the other hand, path coefficient analysis which is a powerful multivariate statistical tool which enables to separate correlation coefficient into direct and indirect effects . Furthermore, path coefficient analysis can aid in prioritizing traits for breeding programs by quantifying their relative importance.
Therefore, this experiment was conducted to analyze the correlation and path coefficients in groundnut genotypes.
2. Materials and Methods
2.1. Description of Experimental Field
The experiment was conducted during 2022 cropping season at Assosa Agricultural Research Center, which is situated in Benishangul Gumuz region of Northwestern Ethiopia. The experimental site is located at 1553 meters above sea level, and at latitude and longitude of 10°02'05''N and 34°34'09''E, respectively. The experimental site has a unimodal rainfall pattern, which starts at the end of April and extends to mid-November, with maximum rainfall received from June to October, with a total annual average rainfall of 1275 mm. The minimum and maximum temperatures are 16.75 and 27.92°C, respectively. The dominant soil type of Asossa area is Nitosols with the soil pH ranging from 5.0 to 6.0 .
2.2. Plant Materials and Design
Fifteen groundnut genotypes (Table 1), comprising thirteen advanced lines from the International Crops Research Institute for the Semi-Arid Tropics (ICRISAT) and two checks (Babile-4 and Sartu) were the plant materials evaluated in the experiment. The evaluation was conducted using a Randomized Complete Block Design (RCBD) with three replications. Each plot contained five rows, each 5 meters long, with 60cm between rows. The spacing within rows was set at 10cm at the time of planting. Additionally, all recommended agronomic practices were followed to ensure optimal crop growth conditions.
Table 1. Groundnut genotypes used in the experiment.

S. No

Genotype

Status

1

ICGV0266

Advanced line

2

ICGV05155

Advanced line

3

ICGV06420

Advanced line

4

ICGV07220

Advanced line

5

ICGV10315

Advanced line

6

ICGV103249

Advanced line

7

ICGV10355

Advanced line

8

ICGV10358

Advanced line

9

ICGV10365

Advanced line

10

ICGV13254

Advanced line

11

ICGV13265

Advanced line

12

ICGV13277

Advanced line

13

ICGV13278

Advanced line

14

Babile-4

Check-1

15

Sartu

Check-2

2.3. Data Collected
Days to 50% flowering (DF) and 90% maturity (DM) were recorded for each plot. To evaluate the resistance of groundnut genotypes against late leaf spot (LLS), caused by Cercosporidium personatum, data were collected from 10 randomly selected plants located within the middle three rows of each plot. The disease severity was assessed using the scale developed by Sarwar and Haq , which categorizes severity as follows: 0 = 0%, 1 = 0.1–5%, 2 = 5.1–10%, 3 = 10.1–20%, 4 = 20. 1–50%, 5 = 50. 1–70%, and 6 = >70%, corresponding to immune, highly resistant, resistant, moderately resistant, moderately susceptible, susceptible, and highly susceptible, respectively. The number of mature pods per plant (MPPP) was assessed on 10 randomly selected plants per plot, while the number of seeds per pod (SPP) was determined from 10 random pods. Shelled kernel yield (ShKY) was measured from the harvest obtained from the middle three rows of each plot, and the weight of 100 kernels (HKW) was determined by weighing 100 kernels sampled from the plot harvest.
2.4. Data Analysis
A The analysis of variance (ANOVA) for the traits in this study was performed using the doebioresearch package within the R software . The ANOVA model used is defined as follows:
yij=μ+Gi+Rj+εij
Here, yij represents the observation of the 𝑖th genotype (Gi) in the jth replication (Rj); μ is the overall mean; Gi denotes the effect of the ith genotype; Rj signifies the effect of the jth replication; and ϵij is the error term. Fisher’s Least Significant Difference (LSD) test was used to compare the means among genotypes, with a significance level set at 5% probability.
The corr_plot function within the metan package of R software was used to estimate the phenotypic and genotypic correlations among the traits. Adjusted means of genotypes for considered traits were used to determine genotypic correlation analysis. To ascertain the direct and indirect effects of traits on kernel yield, a path coefficient analysis was conducted for traits that showed significant genotypic and phenotypic correlations with kernel yield. This analysis was performed using the path. analysis function within the agricolae package within R software.
3. Result and Discussion
3.1. Analysis of Variance and Mean Performance for Yield and Yield Related Traits
The analysis of variance revealed significant differences (P<0.05) among groundnut genotypes for key traits including days to 50% flowering, days to 90% maturity, number of mature pods per plant, 100-kernel weight, and kernel yield. However, there were no significant differences among the tested genotypes regarding the number of kernels per pod and resistance to late leaf spot disease. Similarly, Chandran et al. and Pachauri and Shikarvar reported genetic variability in groundnut for the number of pods per plant, hundred kernel weight, and kernel yield.
Table 2. Analysis of variance for kernel yield and its related traits of groundnut genotypes evaluated at Assosa in 2022.

Block

Genotype

Error

Degree of freedom

2

14

28

Days to 50% flowering

0.26

14.52**

4.64

Late leaf spot

3.24

0.68

0.74

Days to 90% maturity

9.48

38.75***

4.56

Number of mature pods per plant

9.77

118.67***

19.86

Number of kernels per pod

0.06

0.03

0.02

Hundred kernel weight (g)

23.46

95.60***

15.36

Shelled kernel yield (kg ha-1)

106475

542625***

39811

The mean performance of groundnut genotypes, as detailed in Table 3, shows that days to 50% flowering ranged from 51.00 to 60.33, and days to 90% maturity ranged from 156.00 to 169.67. The disease scores for late leaf spot (on a 1-9 scale) varied significantly, with ICGV 10365 recording the lowest score of 1.70 and ICGV 13265 the highest score of 3.67. Despite having lower 100-kernel weights (37.38 g for ICGV 05155 and 46.62 g for ICGV 06420), both genotypes produced the highest number of mature pods per plant. The highest 100-kernel weight was observed in ICGV 0266 at 60.84 g, followed by ICGV 10315 at 57.68 g and ICGV 10355 at 57.04 g. Notably, the farmers' variety, Sartu, a runner type, achieved the highest shelled kernel yield at 1913.45 kg/ha, followed by ICGV 05155 at 1425.49 kg/ha. In contrast, the standard check variety Babile-4, a Virginia type, recorded the lowest shelled kernel yield at 455.65 kg/ha.
Table 3. Mean performance of groundnut genotypes evaluated at Assosa during 2022 cropping year.

Genotype

DF

DM

LLS

MPPP

KPP

HKW

ShKY

Babile-4

51.00d

162.33efg

2.67

5.20de

1.47

47.36de

455.65fg

ICGV 0266

52.33cd

164.00def

2.80

11.47cde

1.40

60.84a

791.53de

ICGV 05155

53.67cd

156.00h

3.20

26.93a

1.80

37.38f

1425.49b

ICGV 06420

53.33cd

161.00fg

2.67

19.13b

1.67

46.62e

1082.15cd

ICGV 07220

55.00bc

164.67cde

2.40

12.40bcd

1.60

56.12abc

842.94de

ICGV 10315

55.00bc

169.33ab

2.53

4.73e

1.40

57.68ab

451.23fg

ICGV 103249

55.67bc

165.67cde

2.87

5.73de

1.47

52.03bcde

545.09efg

ICGV 10355

53.67cd

169.67a

2.10

10.27cde

1.47

57.04abc

533.99efg

ICGV 10358

53.33cd

167.00abcd

3.17

6.67de

1.60

48.75de

562.10efg

ICGV 10365

54.67bc

167.67abc

1.70

11.07cde

1.60

53.43bcd

711.13efg

ICGV 13254

54.00cd

165.00cde

2.40

7.33de

1.60

50.52cde

399.89g

ICGV 13265

60.33a

166.00bcd

3.67

10.47cde

1.60

53.69bcd

659.87efg

ICGV 13277

55.33bc

160.33g

2.30

19.33b

1.67

49.33de

1256.59bc

ICGV 13278

55.00bc

166.00bcd

2.40

8.93de

1.53

49.00de

762.68def

Sartu

57.67ab

166.00bcd

2.53

16.73bc

1.67

51.57bcde

1913.45a

Mean

54.6

164.71

2.62

11.76

1.56

51.42

826.25

CV (%)

3.94

1.29

2.89

37.89

10.61

7.62

24.14

LSD at 5% probability

3.60

3.57

ns

7.45

ns

6.55

333.71

DF=days to 50% flowering, DM=days to 90% maturity, LLS=late leaf spot, MPPP=number of mature pods per plant, KPP=number of kernels per pod, HKW=hundred kernel weight in g, ShKY=Shelled kernel yield (kg ha-1), CV=coefficient of variation, and LSD=least significant difference
3.2. Phenotypic and Genotypic Correlation Coefficients
In the present study, shelled kernel yield exhibited a significant negative phenotypic correlation with days to 90% maturity (rp = -0.45**), indicating that as the maturity period increases, the kernel yield tends to decrease. In the previous study, days to maturity exhibited negative correlation with kernel yield . However, there were significant positive phenotypic correlations between shelled kernel yield and both the number of mature pods per plant (rp = 0.68***) and the number of kernels per pod (rp = 0.44**). Additionally, days to 90% maturity had a positive phenotypic correlation with 100-kernel weight (rp = 0.67***), but a negative correlation with the number of mature pods per plant (rp = -0.55***) and the number of kernels per pod (rp = -0.34*). The number of kernels per pod showed a positive phenotypic correlation with days to 50% flowering (rp = 0.30*) and the number of mature pods per plant (rp = 0.48***). Moreover, 100-kernel weight had a significant negative phenotypic correlation with the number of mature pods per plant (rp = -0.35*).
Shelled kernel yield demonstrated a significant positive genotypic correlation with both the number of mature pods per plant (rg = 0.82***) and the number of kernels per pod (rg = 0.68**). Days to 90% maturity showed a significant positive genotypic correlation with 100-kernel weight (rg = 0.74**), but a negative correlation with the number of mature pods per plant (rg = -0.75**) and the number of kernels per pod (rg = -0.63*). The number of kernels per pod exhibited a strong positive genotypic correlation with the number of mature pods per plant (rg = 0.80***). Additionally, 100-kernel weight had a significant negative genotypic correlation with both the number of mature pods per plant (rg = -0.55*) and the number of kernels per pod (rg = -0.74**).
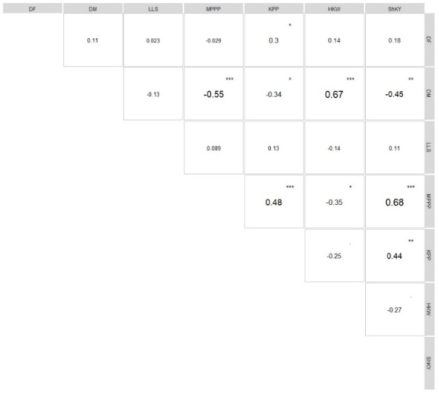
Figure 1. Phenotypic correlation among agro-morphological traits of groundnut at Assosa during 2022 cropping year. DF=days to 50% flowering, DM=days to 90% maturity, MPPP=number of mature pods per plant, KPP=number of kernels per pod, HKW=hundred kernel weight, ShKY=shelled kernel yield.
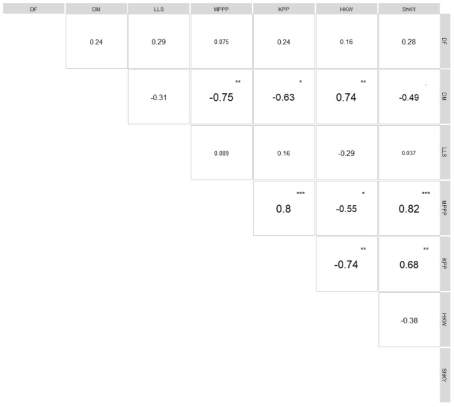
Figure 2. Genotypic correlation among agro-morphological traits of groundnut at Assosa during 2022 cropping year. DF=days to 50% flowering, DM=days to 90% maturity, MPPP=number of mature pods per plant, KPP=number of kernels per pod, HKW=hundred kernel weight, ShKY=shelled kernel yield.
3.3. Phenotypic and Genotypic Path Coefficients
In the current study, the phenotypic path analysis (Figure 3) revealed that the number of mature pods per plant had the most substantial direct positive effect (0.56) on kernel yield. In contrast, days to 90% maturity and the number of kernels per pod showed minor direct negative (-0.19) and positive (0.13) phenotypic effects, respectively. Although the maturity period had a minor direct effect on kernel yield, it exhibited a more significant indirect phenotypic effect (-0.30) on kernel yield through the number of mature pods per plant. Additionally, the number of kernels per pod demonstrated a larger indirect positive phenotypic effect (0.26) on kernel yield via the number of mature pods per plant.
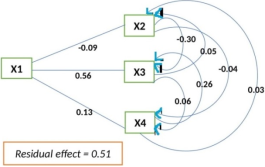
Figure 3. Phenotypic path coefficient. X1=Shelled kernel yield; X2=days to 90% maturity; X3=number of matured pods per plant; X4=number of kernels per pod. Dashes indicate direct effects, and arrowed arcs indicate indirect path coefficients.
The results indicate that increasing the number of mature pods per plant can significantly enhance kernel yield in groundnut. A notable indirect negative impact of the maturity period on kernel yield, through the number of mature pods per plant, suggests that early maturing groundnut genotypes tend to produce fewer pods, which is a critical factor for kernel yield. Additionally, the relatively higher positive indirect phenotypic effect of the number of kernels on kernel yield, via the number of mature pods, implies that groundnut genotypes with more kernels per pod can be considered high-yielding and capable of producing a greater number of pods per plant. The genotypic path coefficient analysis (Figure 4) further showed that the number of mature pods per plant had the most substantial direct positive genotypic effect (0.76) on kernel yield. Conversely, the direct genotypic effect of the number of kernels per pod on kernel yield was insignificant (0.06); however, this trait exhibited the highest indirect positive genotypic effect (0.61) on kernel yield through the number of mature pods per plant. Therefore, both phenotypic and genotypic path coefficients suggest that kernel yield in groundnuts can be effectively improved by indirectly selecting for the number of mature pods per plant. The residual effects from the phenotypic (0.51) and genotypic (0.32) path coefficients indicate that the traits under examination accounted for only 49% and 68% of the variability in kernel yield, respectively. The remaining 51% (phenotypic path) and 32% (genotypic path) of the variance may be attributed to environmental factors and/or other kernel yield-related traits in groundnuts that were not included in the study.
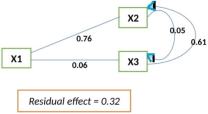
Figure 4. genotypic path coefficient. X1=Shelled kernel yield; X2=number of matured pods per plant; and X3=number of kernels per pod. Dashes indicate direct effects, and arrowed arcs indicate indirect path coefficients.
4. Conclusion
This study highlights the significant variability among groundnut genotypes in terms of flowering time, maturity, mature pods per plant, 100-kernel weight, and kernel yield, underscoring the potential for targeted breeding. Notably, no significant differences were found in kernel number per pod and resistance to late leaf spot disease. The analysis identified a strong positive correlation between kernel yield and both the number of mature pods per plant and kernels per pod, while a negative correlation with days to maturity was observed. Path coefficient analysis further emphasized the critical role of mature pods per plant in enhancing kernel yield, suggesting that indirect selection focusing on this trait could be highly effective. The study revealed that early maturing genotypes tend to produce fewer pods, negatively impacting yield. However, genotypes with more kernels per pod showed higher yields, indicating their potential as high-yielding varieties.
The study implied that late maturing genotypes produce high number of pods in turn exhibit higher kernel yield than early maturing genotypes. Furthermore, the study indicated the importance of selecting for high number of mature pods per plant in groundnut breeding programs to enhance kernel yield.
Abbreviations

DF

Days to 50% Flowering

DM

Days to 90% Maturity

LLS

Late Leaf Spot

MPPP

Number of Mature Pods Per Plant

KPP

Number of Kernels Per Pod

HKW

Hundred Kernel Weight

ShKY

Shelled Kernel Yield

Author Contributions
Sintayehu Gedifew is the sole author. The author read and approved the final manuscript.
Conflicts of Interest
The author declares no conflicts of interest.
References
[1] Yol, E., Ustun, R., Golukcu, M., & Uzun, B. (2017). Oil content, oil yield and fatty acid profile of groundnut germplasm in mediterranean climates. Journal of the American Oil Chemists' Society, 94(6), 787-804.
[2] Asibuo, J. Y., Akromah, R., Safo-Kantanka, O., Adu-Dapaah, H. K., Ohemeng-Dapaah, S., & Agyeman, A. (2008). Chemical composition of groundnut, Arachis hypogaea (L) landraces. African Journal of Biotechnology, 7(13).
[3] Janila, P., Nigam, S. N., Pandey, M. K., Nagesh, P., & Varshney, R. K. (2013). Groundnut improvement: use of genetic and genomic tools. Frontiers in plant science, 4, 23.
[4] FAO (Food and Agriculture Organization of the United Nations) (2021). Food and Agricultural Organization of the United Nations. URL:
[5] CSA (Central Statistical Agency of Ethiopia) (2021). Area and production of major crops. Addis Ababa, Ethiopia.
[6] Khairnar, S. S., & Monpara, B. A. (2013). Identification of potential traits and selection criteria for yield improvement in sesame (Sesamum indicum L.) genotypes under rainfed conditions. Iranian Journal of Genetics and Plant Breeding, 2(2), 1-8.
[7] Biabani, A. R., & Pakniyat, H. (2008). Evaluation of seed yield-related characters in sesame (Sesamum indicum L.) using factor and path analysis. Pakistan Journal of Biological Sciences: PJBS, 11(8), 1157-1160.
[8] Gelalcha, S., & Hanchinal, R. R. (2013). Correlation and path analysis in yield and yield components in spring bread wheat (Triticum aestivum L.) genotypes under irrigated condition in Southern India. African Journal of Agricultural Research, 8(24), 3186-3192.
[9] Coghlan, A. (2017). A little book of R for multivariate analysis. Welcome Sanger Institute.
[10] Gedifew, S., Demelash, H., Abate, A., & Abebe, T. D. (2024). Association of quantitative traits and genetic diversity in Ethiopian sesame (Sesamum indicum L.) genotypes. Heliyon.
[11] Anbessa, B. (2022). Characterizing the Soils of Asossa Agricultural Research Center Farm, with Closer Evaluation of Fertility Status, Asossa Western Ethiopia. J Soil Water Sci 6(2), 305-314.
[12] Sarwar, G., & Haq, M. A. (2006). Evaluation of sesame germplasm for genetic parameters and disease resistance. Journal of Agricultural Research, 44(2), 89–96.
[13] Popat, R. & Banakara, K. (2020). doebioresearch: Analysis of Design of Experiments for Biological Research. R package version 0.1.0.
[14] R Core Team (2023). R: A Language and Environment for Statistical Computing. R Foundation for Statistical Computing, Vienna, Austria.
[15] Olivoto, T., and Lúcio, A. D. (2020). metan: an R package for multi-environment trial analysis. Methods Ecol Evol. 11: 783-789.
[16] De Mendiburu, F., Simon, R. (2015). Agricolae-Ten years of an open-source statistical tool for experiments in breeding. Agriculture and biology, PeerJ PrePrints.
[17] Chandran, A. S., Prashant Kumar Rai, P., Lal, G. M., Kumar, R., & Yadav, B. (2016). Evaluation of Groundnut Genotypes for Agronomic and Seed Quality Traits. International Journal of Plant & Soil Science; 13(2): 1-7.
[18] Pachauri, P., & Shikarvar, R. S. (2019). Study on genetic variability, heritability and genetic advance in groundnut (Arachis hypogaea L.). International Journal of Chemical Studies; 7(4): 1768-1770.
[19] Belay, F., Meresa, H., & Syum, S. (2018). Variation and association for kernel yield and yield related traits of released groundnut (Arachis hypogaea L.) varieties in Abergelle district, northern Ethiopia. Journal of Medicinal Plants Studies, 6, 265-271.
Cite This Article
  • APA Style

    Gedifew, S. (2024). Trait Correlations and Path Analysis for Kernel Yield Improvement in Groundnut (Arachis hypogaea L.) Genotypes. Advances in Bioscience and Bioengineering, 12(4), 98-104. https://doi.org/10.11648/j.abb.20241204.14

    Copy | Download

    ACS Style

    Gedifew, S. Trait Correlations and Path Analysis for Kernel Yield Improvement in Groundnut (Arachis hypogaea L.) Genotypes. Adv. BioSci. Bioeng. 2024, 12(4), 98-104. doi: 10.11648/j.abb.20241204.14

    Copy | Download

    AMA Style

    Gedifew S. Trait Correlations and Path Analysis for Kernel Yield Improvement in Groundnut (Arachis hypogaea L.) Genotypes. Adv BioSci Bioeng. 2024;12(4):98-104. doi: 10.11648/j.abb.20241204.14

    Copy | Download

  • @article{10.11648/j.abb.20241204.14,
      author = {Sintayehu Gedifew},
      title = {Trait Correlations and Path Analysis for Kernel Yield Improvement in Groundnut (Arachis hypogaea L.) Genotypes
    },
      journal = {Advances in Bioscience and Bioengineering},
      volume = {12},
      number = {4},
      pages = {98-104},
      doi = {10.11648/j.abb.20241204.14},
      url = {https://doi.org/10.11648/j.abb.20241204.14},
      eprint = {https://article.sciencepublishinggroup.com/pdf/10.11648.j.abb.20241204.14},
      abstract = {Groundnut (Arachis hypogaea L.), or peanut, is a self-pollinating legume valued for its oil-rich kernels and nitrogen-fixing roots. Given the limited availability of enriched germplasm in Ethiopia, indirect selection through association studies is pivotal for identifying traits linked to high kernel yield. This study evaluated fifteen groundnut genotypes using a Randomized Complete Block Design with three replications to analyze correlations and path coefficients for yield improvement. Significant differences among genotypes were observed for key traits, including days to flowering and maturity, number of mature pods per plant, 100-kernel weight, and kernel yield, indicating the presence of variability among the genotypes in terms of these traits. Correlation analysis revealed a significant negative phenotypic correlation between kernel yield and days to maturity, but positive correlations with number of mature pods per plant and number of kernels per pod. The result revealed that late maturing genotypes produce high number of pods in turn exhibit higher kernel yield than early maturing ones. Genotypic correlations reinforced these findings, highlighting number of mature pods per plant as a critical determinant of yield. Path coefficient analysis indicated that the number of mature pods per plant had the highest direct positive effect on kernel yield, suggesting that enhancing this trait could significantly boost productivity. These results underscore the importance of selecting for high number of mature pods per plant in groundnut breeding programs to enhance kernel yield.
    },
     year = {2024}
    }
    

    Copy | Download

  • TY  - JOUR
    T1  - Trait Correlations and Path Analysis for Kernel Yield Improvement in Groundnut (Arachis hypogaea L.) Genotypes
    
    AU  - Sintayehu Gedifew
    Y1  - 2024/12/27
    PY  - 2024
    N1  - https://doi.org/10.11648/j.abb.20241204.14
    DO  - 10.11648/j.abb.20241204.14
    T2  - Advances in Bioscience and Bioengineering
    JF  - Advances in Bioscience and Bioengineering
    JO  - Advances in Bioscience and Bioengineering
    SP  - 98
    EP  - 104
    PB  - Science Publishing Group
    SN  - 2330-4162
    UR  - https://doi.org/10.11648/j.abb.20241204.14
    AB  - Groundnut (Arachis hypogaea L.), or peanut, is a self-pollinating legume valued for its oil-rich kernels and nitrogen-fixing roots. Given the limited availability of enriched germplasm in Ethiopia, indirect selection through association studies is pivotal for identifying traits linked to high kernel yield. This study evaluated fifteen groundnut genotypes using a Randomized Complete Block Design with three replications to analyze correlations and path coefficients for yield improvement. Significant differences among genotypes were observed for key traits, including days to flowering and maturity, number of mature pods per plant, 100-kernel weight, and kernel yield, indicating the presence of variability among the genotypes in terms of these traits. Correlation analysis revealed a significant negative phenotypic correlation between kernel yield and days to maturity, but positive correlations with number of mature pods per plant and number of kernels per pod. The result revealed that late maturing genotypes produce high number of pods in turn exhibit higher kernel yield than early maturing ones. Genotypic correlations reinforced these findings, highlighting number of mature pods per plant as a critical determinant of yield. Path coefficient analysis indicated that the number of mature pods per plant had the highest direct positive effect on kernel yield, suggesting that enhancing this trait could significantly boost productivity. These results underscore the importance of selecting for high number of mature pods per plant in groundnut breeding programs to enhance kernel yield.
    
    VL  - 12
    IS  - 4
    ER  - 

    Copy | Download

Author Information
  • Abstract
  • Keywords
  • Document Sections

    1. 1. Introduction
    2. 2. Materials and Methods
    3. 3. Result and Discussion
    4. 4. Conclusion
    Show Full Outline
  • Abbreviations
  • Author Contributions
  • Conflicts of Interest
  • References
  • Cite This Article
  • Author Information