Research Article | | Peer-Reviewed

Resistance of Sesame (Sesamum indicum L.) Genotypes Against Bacterial Blight (Xanthomonas campestris pv. sesami) in Benishangul Gumuz Region, Northwestern Ethiopia

Received: 15 July 2024     Accepted: 9 August 2024     Published: 30 August 2024
Views:       Downloads:
Abstract

Bacterial blight poses a significant threat to sesame production in Ethiopia, especially in regions with high rainfall. It causes yield reduction and affects seed quality by inducing premature leaf defoliation. To address these challenges, evaluating existing germplasm for disease resistance is crucial. This study assessed various sesame genotypes for resistance to bacterial blight and their performance in seed yield and seed yield related traits. Seventeen genotypes were evaluated in a randomized complete block design at Kamashi research sub-station. Resistance evaluations were conducted every 14 days from emergence up to 72 days, along with recording seed yield and related agronomic and morphological traits. The mean area under the disease progress curve (AUDPC) varied from 673.86 to 825.01, indicating differing susceptibility levels to disease advancement. Approximately 46.67% of the tested genotypes exhibited lower AUDPC compared to Benishangul-1, a variety specifically developed for its adaptability and resistance for bacterial blight-prone regions. Initially, at 14 and 28 days after emergence (DAE), no noticeable bacterial blight symptoms were observed across the genotypes. However, at 42, 56, and 72 DAE, the average severity index steadily rose to 16.92%, 20.78%, and 27.71%, respectively. This transition from immunity to moderate susceptibility underscores the dynamic nature of disease progression and the significant challenge posed by bacterial blight in later sesame growth stages. Notably, significant differences (P<0.05) were noted in days to 50% flowering, days to 90% maturity, plant height to the first branch, overall plant height, length of the capsule-bearing zone, and seed yield. This comprehensive evaluation offers valuable insights into the genetic diversity to improve crop performance and yield potential.

Published in Advances in Bioscience and Bioengineering (Volume 12, Issue 3)
DOI 10.11648/j.abb.20241203.12
Page(s) 58-66
Creative Commons

This is an Open Access article, distributed under the terms of the Creative Commons Attribution 4.0 International License (http://creativecommons.org/licenses/by/4.0/), which permits unrestricted use, distribution and reproduction in any medium or format, provided the original work is properly cited.

Copyright

Copyright © The Author(s), 2024. Published by Science Publishing Group

Keywords

Area Under Disease Progress Curve, Bacterial Blight (Xanthomonas campestris pv. sesami), Disease Reaction, Percentage of Severity Index, Seed Yield

1. Introduction
Sesame (Sesamum indicum L.), a member of the Pedaliaceae family, stands as one of the oldest oilseed crops . Hence most wild species of the genus Sesamum thrive in Africa, sesame is widely believed to have originated on the continent . Despite its susceptibility to rainy conditions , sesame exhibits remarkable tolerance to drought and thrives in relatively high temperatures, enabling it to maintain substantial seed yield .
The majority of global sesame production occurs in Africa and Asia . Notably, Ethiopia is a key player in sesame production and exportation on a global scale. In 2018, Ethiopia contributed approximately 200,000 tons of sesame, cultivated on 294,819 hectares of land . The regions of Amhara, Tigray, Oromia, Benishangul Gumuz, and Somali in Ethiopia boast favorable agro-ecological conditions for sesame cultivation .
Despite the favorable agro-ecologies conducive to sesame production and its pivotal role as a source of income for both the country and its farmers, productivity has been hindered by various biotic and abiotic factors. Among these factors, bacterial blight (Xanthomonas campestris pv. sesami) stands out as the primary disease threatening sesame cultivation in Ethiopia, particularly in regions with high rainfall and humidity , such as Benishangul Gumuz, Northwestern Ethiopia. In Northwestern Ethiopia, such as Wollega and Benishangul Gumuz, Wollega and Gambella, bacterial blight can lead to complete crop failure, especially when farmers use varieties non-adaptable to these high rainfall areas. Bacterial blight typically manifests during the rainy season when humidity levels are high, resulting in defoliation and sterility under severe conditions . Studies have shown a notably high severity index of bacterial blight in areas with substantial rainfall in Northwestern Ethiopia , whereas its severity is comparatively lower in semi-arid areas and in areas with optimal moisture levels when contrasted with the high rainfall areas of Northwestern Ethiopia. In high rainfall areas such as Wollega, Kamashi, and certain parts of Metekel, frequent heavy rains can exacerbate sesame susceptibility to bacterial blight due to waterlogging. This disease not only diminishes sesame yields but also adversely affects seed quality by causing defoliation of leaves before seeds reach full maturity.
To address the challenges of seed yield loss and seed quality deterioration in sesame, it is imperative to harness the potential of existing germplasm by systematically evaluating and screening elite breeding plant materials for resistance to bacterial blight, particularly in regions hot spot to the disease. Therefore, the current study aims to assess various sesame genotypes for their resistance to bacterial blight disease and to evaluate their performance in terms of yield and related traits under field conditions in the high rainfall areas of Northwestern Ethiopia.
2. Materials and Methods
2.1. Experimental Site, Plant Materials and Design
The experimental site is situated in the Kamashi zone, within the Benishangul Gumuz region of Northwestern Ethiopia, at a latitude of 09°30′N and longitude of 35°45′E. It is positioned at an altitude ranging from 1000 to 1350 meters above sea level (m.a.s.l). This area experiences an average annual rainfall of 1150 mm, along with a minimum and maximum mean daily temperature of 25°C and 30°C, respectively. Notably, the Benishangul Gumuz region is known as a hotspot for bacterial blight infestation, often reaching a severity index of up to 100% due to persistent rainfall and humidity (. During the 2017/18 cropping season, seventeen genotypes (as listed in Table 1) were evaluated for their resistance against bacterial blight disease (Xanthomonas campestris pv. sesami). These genotypes comprised three varieties (Acc-51-02-sel-6(2), Benishangul-1, and Tate) and 14 advanced lines. The advanced lines were screened from a larger pool of genotypes evaluated for bacterial blight resistance in the preceding 2016/17 season. The experimental design employed was a Randomized Complete Block Design (RCBD) with three replications. Each plant material was sown on plots measuring 2 meters in width and 5 meters in length, with intra-row spacing of 10cm and inter-row spacing of 40cm.
Table 1. Description of plant materials used in the experiment.

S. No

Genotype

Status

1

Acc-202-374

Advanced line

2

Acc-51-02-sel-6(2)

Released variety

3

Benishangul-1

Released variety

4

Tate

Released variety

5

WARC-100

Advanced line

6

WARC-103

Advanced line

7

WARC-59

Advanced line

8

WARC-63

Advanced line

9

WARC-70

Advanced line

10

WARC-72

Advanced line

11

WARC-74

Advanced line

12

WARC-81

Advanced line

13

WARC-84

Advanced line

14

WARC-87

Advanced line

15

WARC-88

Advanced line

16

WARC-92

Advanced line

17

WARC-93

Advanced line

2.2. Data Collected
Days to 50% flowering (DF) and 90% maturity (DM) were meticulously recorded on a plot-by-plot basis for each replicate. In assessing bacterial blight disease severity, data were gathered from 10 randomly chosen and pre-tagged plants situated within the middle rows of every plot. The assessment of bacterial blight disease severity took place at five times, every 14 days from 14 up to 72 days after emergence, utilizing the scale established by Sarwar and Haq , where severity levels were categorized as follows: 0 = 0%, 1 = 0.1–5%, 2 = 5.1–10%, 3 = 10.1–20%, 4 = 20.1–50%, 5 = 50.1–70%, 6 = >70%, corresponding to immune, highly resistant, resistant, moderately resistant, moderately susceptible, susceptible, and highly susceptible, respectively. Subsequently, these severity grades were converted into a percentage severity index (PSI) using Wheeler's formula, which is as follows: -
PSI %=Sum of all disease scoresNumber of ratings×Maximum disease grade×100
The area under the disease progress curve (AUDPC) was estimated for each observation as suggested by Madden et al. as follows:-
AUDPC=i=1n-1yi+yi+12(ti+1-ti)
Where, yi is an assessment of a disease at the ith observation, ti is time in days at the ith observation, and n is the total number of observations. During harvesting, data were recorded for yield and yield-related traits at three levels: plant basis, capsule basis, and plot basis. Data collection for seed yield and morphological traits followed the sesame descriptor . Plant height to the first branch (PHFB), overall plant height (PH), the length of the capsule-bearing zone (LCBZ), number of primary branches per plant (PBPP), and number of capsules per plant (CPP) were recorded for 10 randomly selected plants in each plot. Additionally, the number of seeds per capsule (SPC) was assessed by examining five capsules from the bottom towards the tip on the main stem of each plant. Seed yield (SY) per plot was determined from three middle rows, while the thousand-seed weight (TSW) was measured after counting 1000 seeds which sampled from the harvest per plot.
2.3. Data Analysis
Analysis of variance (ANOVA) for the traits considered in this study was conducted using the doebioresearch package within the R software . The model employed for the analysis of variance is as follows:
yij=μ+Gi+Rj+εij
Where, yij is the observation of the ith genotype (G) in the jth replication (R); μ is the overall mean; Gi is the ith genotype (G) effect; Rj is the jth replication (R) effect; and εij is an error term. Tukey test was utilized to compare means among genotypes at a significance level of 5% probability.
3. Result and Discussion
3.1. Resistance of Sesame Genotypes Against Bacterial Blight (Xanthomonas campestris pv. sesami)
The data collected subjected to an analysis of variance to examine variability among genotypes concerning disease resistance and their performance in yield and related traits (Table 2). Notably, there were no statistically significant variation observed among the genotypes for the area under disease progress curve (AUDPC). The AUDPC serves to quantify the cumulative disease severity or advancement across time intervals. This parameter offers a thorough evaluation of disease evolution dynamics and proves valuable in contrasting disease progression across various genotypes. Across the sesame genotypes assessed, the mean AUDPC ranged from 673.86 to 825.01 (Table 3), indicating varying levels of susceptibility to disease progression. The highest AUDPC (825.01) was recorded on WARC-63 and the lowest AUDPC (673.86) was recorded on WARC-81. This discrepancy underscores the potential for genotype-specific resistance mechanisms against bacterial blight disease, shedding light on avenues for sesame improvement for bacterial blight resistance through genotypic selection. About 46.67% of the tested genotypes demonstrated low AUDPC compared to Benishangul-1, a variety released for its adaptability in high rainfall and bacterial blight hot spot areas, such as Kamashi, Assosa, and Metekel zones, and similar agro-ecologies. Despite its initial acclaim, Benishangul-1's yield potential has shown signs of deterioration over time. This decline can be attributed, in part, to the increasingly harsh weather conditions, characterized by intensified and prolonged rainfall in the region. Such environmental stresses pose formidable challenges to crop resilience and productivity, highlighting the imperative for ongoing research and breeding efforts aimed at bolstering the resilience of sesame varieties to evolving climatic conditions. The progression of bacterial blight infection in sesame genotypes unfolds in a nuanced manner, as depicted in Figure 2. Initially, at 14 and 28 days after emergence (DAE), no discernible symptoms of bacterial blight were observed across the genotypes. However, as the plants advanced through their growth stages, notably at 42, 56, and 72 DAE, the mean percentage of severity index steadily increased to 16.92%, 20.78%, and 27.71%, respectively. This escalation in disease severity notably coincides with the onset of flower initiation, marking the transition into the critical reproductive phase of sesame development. Similarly, bacterial blight disease was found as prominent in West Gondar, Northwestern Ethiopia . In a testing site, located in Kamashi zone, the mean percentage of severity index in landrace collections ranges from 24.76 to 40.34% . Further, higher percentage of severity index reaching 77.40% has been observed in other sesame genotypes at the same testing site .
Table 2. Mean square values for disease and seed yield related traits of sesame genotypes evaluated at Kamashi during 2017/18 cropping season.

Character

Mean squares

Block (df=2)

Genotype (df=16)

Error (df=32)

Days to 50% flowering

5.70

17.59**

5.99

Days to 90% maturity

1.19

24.06***

4.50

Area under disease progress curve

71889

4128ns

5435

Plant height to first branching (cm)

120.30

67.52**

25.07

Plant height (cm)

970.57

224.78**

72.30

Length of capsule bearing zone (cm)

146.65

78.99*

32.00

Number of primary branches per plant

0.79

0.69ns

0.45

Number of capsules per plant

483.07

181.50ns

118.07

Number of seeds per capsule

56.61

32.20ns

21.39

1000 seeds weight (g)

0.20

0.30ns

0.18

Seed yield per hectare (kg)

121397

34016*

14462

df=degree of freedom
The incidence and severity of bacterial blight vary depending on agroecological conditions, reaching up to 100% in Northwestern Ethiopia where rainfall and humidity levels are high , and ranging from 10% to 50% in semi-arid areas such as Werer and Humera . In optimum moisture areas of Norther Ethiopia, bacterial blight disease severity index (%) ranges from 9.30 to 39.15% . Remarkably, certain genotypes exhibited a remarkable resilience to bacterial blight at key time points. WARC-81 was found as a standout performer, showing the lowest percentage of severity index at 42 DAE, closely followed by WARC-92 and WARC-59. Similarly, at 72 DAE, WARC-81 and WARC-70 demonstrated notable resistance, underscoring their potential as valuable genetic resources for breeding programs aimed at enhancing disease tolerance in sesame cultivars. Conversely, the variety Tate, alongside genotypes WARC-63 and WARC-92, succumbed to higher levels of bacterial blight infection, particularly evident at 72 DAE, where they exhibited the highest percentage of severity index. This discrepancy shows the inherent variability in disease susceptibility among sesame genotypes, underscoring the importance of intensive evaluation of available sesame germplasm to overcome the impact of the disease in sesame production. Beyond the confines of this study, these findings carry profound implications for sesame cultivation practices and breeding strategies. By elucidating the dynamics of bacterial blight infection across critical growth stages, stakeholders gain valuable insights into optimal disease management practices and the identification of resilient genotypes for future breeding endeavors. Moreover, this study underscores the imperative for ongoing research aimed at unraveling the genetic mechanisms underpinning disease resistance in sesame, paving the way for the development of tailored interventions to safeguard yield stability and enhance agricultural sustainability in sesame-growing regions.
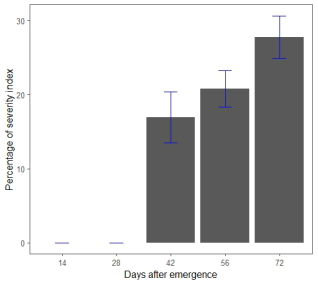
Figure 1. Mean percentage of severity index of sesame genotypes at 14, 28, 42, 56, and 72 days after emergence during 2017/18 at Kamashi.
Despite the absence of visible symptoms of bacterial blight disease infection at 14 and 28 days after emergence (DAE) (Figure 1), a notable shift in disease response emerged as the sesame plants progressed through their growth stages. By 42 DAE, a significant development unfolded: all genotypes displayed a uniform pattern of moderate resistance, characterized by a 10.1 – 20% range in the percentage of severity index (Figure 2). This collective resilience across the genotypic spectrum underscores the inherent capacity of sesame plants to mount an effective defense against bacterial blight at this crucial juncture of growth. However, the resilience observed at 42 DAE began to wane as the plants advanced in age. As shown in Table 3, by 56 DAE, only 35.29% of the genotypes retained their moderate resistance, signaling a shift in disease dynamics. Notably, among the remaining genotypes exhibiting moderate resistance at this stage were two varieties, Benishangul-1 and Tate, alongside four advanced lines, including WARC-59, WARC-74, WARC-81, and WARC-84. This subset of genotypes demonstrates a sustained ability to mitigate bacterial blight infection, highlighting their potential as key genetic resources for breeding programs aimed at enhancing disease resistance in sesame cultivars. However, by 72 DAE, moderate susceptibility, defined by a 20.1 – 50% range in the percentage of severity index, permeated across all genotypes (Figure 2). This marked transition from moderate resistance to moderate susceptibility underscores the dynamic nature of disease progression and the formidable challenge posed by bacterial blight in later stages of sesame development. These findings carry significant implications for sesame breeding and disease management strategies. The transient nature of moderate resistance observed during the critical growth stages underscores the importance of timely interventions and vigilant monitoring to curtail disease spread. Moreover, the identification of resilient genotypes, such as Benishangul-1 and select advanced lines, offers promising avenues for future breeding efforts aimed at fortifying sesame cultivars against bacterial blight disease.
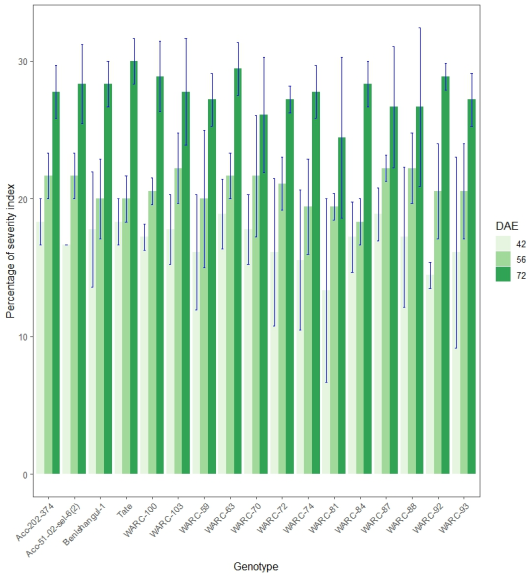
Figure 2. Percentage of severity index in sesame genotypes at 42, 56, and 72 days after emergence during 2017/18 at Kamashi.

Genotype

14 DAE

28 DAE

42 DAE

56 DAE

72 DAE

PSI

DR

PSI

DR

PSI

DR

PSI

DR

PSI

DR

Acc-202-374

0.00

NS

0.00

NS

18.33

MR

21.67

MS

27.78

MS

Acc-51-02-sel-6(2)

0.00

NS

0.00

NS

16.67

MR

21.67

MS

28.34

MS

Benishangul-1

0.00

NS

0.00

NS

17.78

MR

20.00

MS

28.33

MS

Tate

0.00

NS

0.00

NS

18.33

MR

20.00

MS

30.00

MS

WARC-100

0.00

NS

0.00

NS

17.22

MR

20.56

MS

28.89

MS

WARC-103

0.00

NS

0.00

NS

17.78

MR

22.22

MS

27.78

MS

WARC-59

0.00

NS

0.00

NS

16.11

MR

20.00

MS

27.22

MS

WARC-63

0.00

NS

0.00

NS

18.89

MR

21.67

MS

29.44

MS

WARC-70

0.00

NS

0.00

NS

17.78

MR

21.67

MS

26.11

MS

WARC-72

0.00

NS

0.00

NS

16.11

MR

21.11

MS

27.22

MS

WARC-74

0.00

NS

0.00

NS

15.56

MR

19.44

MR

27.78

MS

WARC-81

0.00

NS

0.00

NS

13.33

MR

19.44

MR

24.44

MS

WARC-84

0.00

NS

0.00

NS

17.22

MR

18.33

MR

28.33

MS

WARC-87

0.00

NS

0.00

NS

18.89

MR

22.22

MS

26.67

MS

WARC-88

0.00

NS

0.00

NS

17.22

MR

22.22

MS

26.67

MS

WARC-92

0.00

NS

0.00

NS

14.44

MR

20.56

MS

28.89

MS

WARC-93

0.00

NS

0.00

NS

16.11

MR

20.56

MS

27.22

MS

Mean

NA

NA

16.92

20.78

27.71

Standard error of mean

NA

NA

1.70

1.42

1.58

P-value

NA

NA

0.672

0.823

0.770

Coefficient of variation

NA

NA

17.39

11.90

9.92

DAE=days after emergence; PSI=percentage of severity index; DR=disease reaction; NS=no symptom; MR=moderate resistant; MS=moderate susceptible; NA=not applicable
3.2. Performance of Sesame Genotypes for Seed Yield and Its Related Traits
The analysis of variance unveiled significant difference among the sesame genotypes, particularly concerning critical agronomic traits (Table 2). Notably, significant differences (P<0.05) were observed for days to 50% flowering, days to 90% maturity, plant height to the first branch, overall plant height, length of the capsule-bearing zone, and seed yield. Similarly, significant variability reported among sesame genotypes for days to 50% flowering, 90% days to maturity, plant height to first branch, length of capsule bearing zone, number of branches per plant, and seed yield . This comprehensive assessment provides invaluable insights into the genetic diversity underlying sesame cultivation, offering a roadmap for targeted breeding efforts to enhance crop performance and yield potential. However, certain traits exhibited remarkable consistency across genotypes. Notably, no significant differences were detected for the number of primary branches per plant, number of capsules per plant, number of seeds per capsule, and 1000-seed weight. The mean number of days to 90% maturity spanned a range from approximately 102 to 112 days, highlighting the variability in growth duration among the genotypes. Notably, WARC-84 emerged as the tallest genotype, followed by WARC-87, whereas WARC-103 and WARC-81 exhibited comparatively shorter stature (Table 4). Genotype WARC-84 also exhibited the highest number of primary branches per plant, number of capsules per plant, and seed yield. This genotype significantly outperformed the two released varieties, Acc-51-02-sel-6(2) and Tate, in terms of seed yield (Figure 3). However, the maximum yield recorded is lower than the national sesame productivity average (680 kg ha-1) , as well as the maximum yield recorded on elite genotypes at the same site . Furthermore, within the tested genotypes, Tate and Acc-202-374 were characterized by their larger seed size, with 1000-seed weights of 2.84 g and 2.72 g, respectively. This distinction underscores the significance of seed morphology in influencing yield potential and market value, highlighting avenues for future breeding efforts aimed at enhancing seed quality and commercial viability.
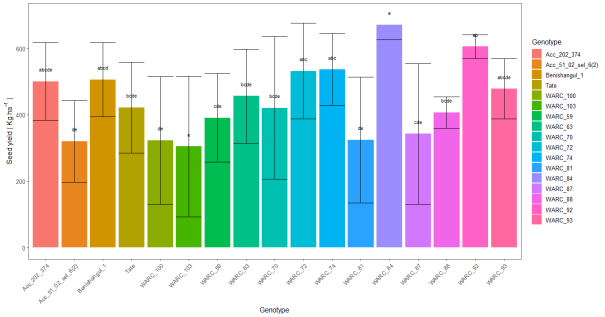
Figure 3. Mean seed yield comparisons of sesame genotypes evaluated at Kamashi during 2017/18 cropping season.
Table 4. Performance of sesame genotypes for bacterial blight disease resistance and seed yield related traits at Kamashi during 2017/18 cropping year.

Genotype

50%DF

AUDPC

90%DM

PHFB

PH

LCBZ

PBPP

CPP

SPC

TSW

SY

Acc-202-374

51.67c-e

803.91

106.00bcd

38.50ab

100.63b-e

49.73b-f

3.03

43.13

71.70

2.72

500.51a-e

Acc-51-02-sel-6(2)

56.33ab

785.07

108.67bc

42.77a

103.47b-e

46.07def

3.40

37.47

75.37

2.25

319.99de

Benishangul-1

57.00a

775.59

109.33ab

42.70a

102.30b-e

47.57c-f

3.40

36.83

74.97

2.30

505.81a-d

Tate

55.67a-c

796.67

105.33cd

30.47bcd

102.83b-e

54.50a-e

3.70

44.90

72.70

2.84

421.57b-e

WARC-100

52.67b-e

780.60

102.67de

39.10a

107.70abc

44.47f

2.80

37.60

68.03

2.60

322.83de

WARC-103

51.67cde

804.44

102.67de

29.87cd

91.43e

47.63c-f

3.23

37.50

69.77

1.71

304.78e

WARC-59

53.33a-d

743.35

106.00bcd

40.33a

105.77a-d

45.43ef

2.73

26.70

69.70

2.27

390.87cde

WARC-63

55.00abc

825.01

107.00bc

37.60a-d

98.80cde

45.93def

3.50

42.83

72.93

2.60

456.19b-e

WARC-70

53.67a-d

782.78

108.33bc

37.10a-d

90.70e

44.17f

2.57

39.33

74.73

2.32

420.55b-e

WARC-72

50.00de

759.98

108.33bc

39.00a

111.33abc

56.70abc

2.90

44.70

76.67

2.37

531.74abc

WARC-74

55.67abc

731.68

106.00bcd

43.83a

110.73abe

59.30a

3.30

40.23

77.37

2.47

536.27abc

WARC-81

56.00ab

673.86

108.67bc

39.01a

92.10de

44.77f

2.73

29.60

74.20

2.10

324.46de

WARC-84

55.67abc

742.79

108.67bc

42.57a

118.90a

53.23a-f

4.30

58.43

75.90

2.15

671.23a

WARC-87

52.33b-e

811.14

109.33ab

38.07abc

117.77a

54.60a-e

3.87

52.97

72.87

1.70

342.75cde

WARC-88

54.33abc

787.81

109.33ab

43.00a

113.17ab

54.87a-d

3.78

46.47

76.30

2.41

406.67b-e

WARC-92

49.00e

741.65

101.67e

29.33d

106.57abc

57.30ab

2.80

49.47

69.47

2.48

605.26ab

WARC-93

57.00a

751.65

112.33a

43.90a

113.13ab

53.13a-f

3.47

41.23

80.37

2.72

478.03a-e

Mean

53.94

770.46

107.07

38.65

105.13

50.55

3.26

41.72

73.70

2.35

443.50

Standard error of mean

1.41

42.56

1.22

2.89

4.90

3.26

0.39

6.27

2.67

0.25

69.43

P-value

0.004

0.715

2.885e-05

0.008

0.003

0.014

0.156

0.146

0.158

0.116

0.019

Coefficient of variation

4.54

9.56

1.98

12.95

8.08

11.19

20.72

26.03

6.27

18.43

27.11

DF= days to flowering; AUDPC=area under disease progress curve; DM=days to maturity; PHFB=plant height to first branching in cm; PH=plant height in cm; LCBZ=length of capsule bearing zone in cm; PBPP=number of primary branches per plant; CPP=number of capsules per plant; SPC=number of seeds per capsule; TSW=1000 seeds weight in g; SY=seed yield per hectare
4. Conclusion
Surprisingly, certain genetic types displayed notable resistance to bacterial blight at crucial stages. Among these, WARC-81 emerged as a standout, exhibiting the lowest severity index at 42 days after emergence (DAE), closely trailed by WARC-92 and WARC-59. Throughout the evaluation period, the genotypes exhibited varying responses to bacterial blight, ranging from immunity between 14 and 28 DAE to moderate susceptibility from 42 to 72 DAE. This transition from immunity to moderate susceptibility highlights the dynamic nature of disease progression and the significant challenge posed by bacterial blight during later stages of sesame growth. Furthermore, these findings hold significant implications for sesame cultivation methods and breeding approaches. By unraveling the dynamics of bacterial blight infection across critical growth phases, stakeholders can gain valuable insights into effective disease management practices and the identification of resilient genotypes for future breeding efforts.
Abbreviations

AUDPC

Area Under Disease Progress Curve

DAE

Days After Emergence

PSI

Percentage of Severity Index

Acknowledgments
The Ethiopian Institute of Agricultural Research is duly acknowledged for its financial support.
Author Contributions
Sintayehu Gedifew is the sole author. The author read and approved the final manuscript.
Conflicts of Interest
The author declares no conflicts of interest.
References
[1] Ashri, A. (1998). Sesame breeding. Plant breeding reviews, 16, 179-228.
[2] Zeven, A., &Zhukovsky, P. (1975). Dictionary of cultivated plants and their centers of diversity. Wageningen, Netherlands.
[3] Carlsson, A. S., Chanana, N. P., Gudu, S., Suh, M. C., & Were, B. A. I. (2008). Sesame. Compendium of transgenic crop plants.
[4] Food and Agriculture Organization of the United Nations (FAO) (2019). Food and Agricultural Organization of the United Nations. Detailed trade matrix. Available at:
[5] Central Statistical Agency (CSA) of Ethiopia. (2019). Agricultural sample survey 2018/19 (2011 E. C.) report on area and production of major crops for private peasant holdings, Meher season, volume I.
[6] Terefe, G., Wakjira A., Berhe, M., & Tadesse, H. (2012). Sesame production manual. Ethiopian Institute of Agricultural Research & Embassy of the Kingdom of the Netherlands, Ethiopia.
[7] Bashir, S., Ul-Haque, M. I., Mukhtar, T., Irshad, G., Hussain, M. A. (2007). Pathogenic variation in Pseudomonas syringae and Xanthomonas campestris pv. sesami associated with blight of sesame. Pakistan Journal of Botany, 39: 939-943.
[8] Gedifew, S. (2022). Characterization and evaluation of sesame (Sesamum indicum L.) accessions. International Journal of Agricultural and Natural Sciences, 15(3), 226-239.
[9] Yaregal, W. (2022). Review on Sesame (Sesamum indicum L.) Production Challenges and Opportunities in Ethiopia. World Journal of Agriculture & Soil Science, 8(1).
[10] Golla, W. N., Kebede, A. A. & Kindeya, Y. B. (2020). Evaluation of sesame genotypes for seed yield and bacterial blight (Xanthomonas campestris pv. sesami) disease resistance in optimum moisture areas of Western Tigray, Ethiopia. Cogent Food & Agriculture, 6(1), 1771114.
[11] Sarwar, G., & Haq, M. A. (2006). Evaluation of sesame germplasm for genetic parameters and disease resistance. Journal of Agricultural Research, 44(2), 89–96.
[12] Wheeler, B. E. J. (1969). An introduction to plant diseases. An introduction to plant diseases. Wiley & Sons.
[13] Madden, L. V., Hughes, G., & Van Den Bosch, F. (2007). The study of plant disease epidemics. The American Phytopathological Society.
[14] IPGRI and NBPGR (2004). Descriptors for Sesame (Sesamum spp.), International Plant Genetic Resources Institute, Rome, Italy and National Bureau of Plant Genetic Resources, New Delhi, India.
[15] Popat, R. & Banakara, K. (2020). doebioresearch: Analysis of Design of Experiments for Biological Research. R package version 0.1.0.
[16] R Core Team (2023). R: A Language and Environment for Statistical Computing. R Foundation for Statistical Computing, Vienna, Austria.
[17] Kefale, Y., Ambaw, A., Worku, M., & Gelaye, M. (2021). Assessment of Major Insect Pests and Diseases of Sesame (Sesamum orientale L) in West Gondar Zone, Ethiopia. Abyssinia Journal of Science and Technology, 6(1), 6-11.
[18] Gedifew S., Robsa A. (2022) Performance of Elite Sesame Genotypes (Sesamum Indicum L.) Collected from Western Ethiopia. Advances in Crop Science and Technology, 10, 531.
[19] Gedifew, S., Abate, A. & Abebe, T. (2023). Genetic variability in sesame (Sesamum indicum L.) for yield and yield related traits. Harran Tarım ve Gıda Bilimleri Dergisi, 27(2), 153-165.
Cite This Article
  • APA Style

    Gedifew, S. (2024). Resistance of Sesame (Sesamum indicum L.) Genotypes Against Bacterial Blight (Xanthomonas campestris pv. sesami) in Benishangul Gumuz Region, Northwestern Ethiopia. Advances in Bioscience and Bioengineering, 12(3), 58-66. https://doi.org/10.11648/j.abb.20241203.12

    Copy | Download

    ACS Style

    Gedifew, S. Resistance of Sesame (Sesamum indicum L.) Genotypes Against Bacterial Blight (Xanthomonas campestris pv. sesami) in Benishangul Gumuz Region, Northwestern Ethiopia. Adv. BioSci. Bioeng. 2024, 12(3), 58-66. doi: 10.11648/j.abb.20241203.12

    Copy | Download

    AMA Style

    Gedifew S. Resistance of Sesame (Sesamum indicum L.) Genotypes Against Bacterial Blight (Xanthomonas campestris pv. sesami) in Benishangul Gumuz Region, Northwestern Ethiopia. Adv BioSci Bioeng. 2024;12(3):58-66. doi: 10.11648/j.abb.20241203.12

    Copy | Download

  • @article{10.11648/j.abb.20241203.12,
      author = {Sintayehu Gedifew},
      title = {Resistance of Sesame (Sesamum indicum L.) Genotypes Against Bacterial Blight (Xanthomonas campestris pv. sesami) in Benishangul Gumuz Region, Northwestern Ethiopia
    },
      journal = {Advances in Bioscience and Bioengineering},
      volume = {12},
      number = {3},
      pages = {58-66},
      doi = {10.11648/j.abb.20241203.12},
      url = {https://doi.org/10.11648/j.abb.20241203.12},
      eprint = {https://article.sciencepublishinggroup.com/pdf/10.11648.j.abb.20241203.12},
      abstract = {Bacterial blight poses a significant threat to sesame production in Ethiopia, especially in regions with high rainfall. It causes yield reduction and affects seed quality by inducing premature leaf defoliation. To address these challenges, evaluating existing germplasm for disease resistance is crucial. This study assessed various sesame genotypes for resistance to bacterial blight and their performance in seed yield and seed yield related traits. Seventeen genotypes were evaluated in a randomized complete block design at Kamashi research sub-station. Resistance evaluations were conducted every 14 days from emergence up to 72 days, along with recording seed yield and related agronomic and morphological traits. The mean area under the disease progress curve (AUDPC) varied from 673.86 to 825.01, indicating differing susceptibility levels to disease advancement. Approximately 46.67% of the tested genotypes exhibited lower AUDPC compared to Benishangul-1, a variety specifically developed for its adaptability and resistance for bacterial blight-prone regions. Initially, at 14 and 28 days after emergence (DAE), no noticeable bacterial blight symptoms were observed across the genotypes. However, at 42, 56, and 72 DAE, the average severity index steadily rose to 16.92%, 20.78%, and 27.71%, respectively. This transition from immunity to moderate susceptibility underscores the dynamic nature of disease progression and the significant challenge posed by bacterial blight in later sesame growth stages. Notably, significant differences (P<0.05) were noted in days to 50% flowering, days to 90% maturity, plant height to the first branch, overall plant height, length of the capsule-bearing zone, and seed yield. This comprehensive evaluation offers valuable insights into the genetic diversity to improve crop performance and yield potential.
    },
     year = {2024}
    }
    

    Copy | Download

  • TY  - JOUR
    T1  - Resistance of Sesame (Sesamum indicum L.) Genotypes Against Bacterial Blight (Xanthomonas campestris pv. sesami) in Benishangul Gumuz Region, Northwestern Ethiopia
    
    AU  - Sintayehu Gedifew
    Y1  - 2024/08/30
    PY  - 2024
    N1  - https://doi.org/10.11648/j.abb.20241203.12
    DO  - 10.11648/j.abb.20241203.12
    T2  - Advances in Bioscience and Bioengineering
    JF  - Advances in Bioscience and Bioengineering
    JO  - Advances in Bioscience and Bioengineering
    SP  - 58
    EP  - 66
    PB  - Science Publishing Group
    SN  - 2330-4162
    UR  - https://doi.org/10.11648/j.abb.20241203.12
    AB  - Bacterial blight poses a significant threat to sesame production in Ethiopia, especially in regions with high rainfall. It causes yield reduction and affects seed quality by inducing premature leaf defoliation. To address these challenges, evaluating existing germplasm for disease resistance is crucial. This study assessed various sesame genotypes for resistance to bacterial blight and their performance in seed yield and seed yield related traits. Seventeen genotypes were evaluated in a randomized complete block design at Kamashi research sub-station. Resistance evaluations were conducted every 14 days from emergence up to 72 days, along with recording seed yield and related agronomic and morphological traits. The mean area under the disease progress curve (AUDPC) varied from 673.86 to 825.01, indicating differing susceptibility levels to disease advancement. Approximately 46.67% of the tested genotypes exhibited lower AUDPC compared to Benishangul-1, a variety specifically developed for its adaptability and resistance for bacterial blight-prone regions. Initially, at 14 and 28 days after emergence (DAE), no noticeable bacterial blight symptoms were observed across the genotypes. However, at 42, 56, and 72 DAE, the average severity index steadily rose to 16.92%, 20.78%, and 27.71%, respectively. This transition from immunity to moderate susceptibility underscores the dynamic nature of disease progression and the significant challenge posed by bacterial blight in later sesame growth stages. Notably, significant differences (P<0.05) were noted in days to 50% flowering, days to 90% maturity, plant height to the first branch, overall plant height, length of the capsule-bearing zone, and seed yield. This comprehensive evaluation offers valuable insights into the genetic diversity to improve crop performance and yield potential.
    
    VL  - 12
    IS  - 3
    ER  - 

    Copy | Download

Author Information